Changes of Effective Connectivity in the Alpha Band Characterize Differential Processing of Audiovisual Information in Cross-Modal Selective Attention
Weikun Niu 1,2,4 Yuying Jiang 1,2,4 Xin Zhang 1,2 Tianzi Jiang 1,2,3,4 Yujin Zhang 1,2 Shan Yu 1,2,3,4
1 Brainnetome Center, Institute of Automation, Chinese Academy of Sciences, Beijing 100190, China
2 National Laboratory of Pattern Recognition, Institute of Automation, Chinese Academy of Sciences, Beijing 100190, China
3 Center for Excellence in Brain Science and Intelligence Technology, Chinese Academy of Sciences, Beijing 100190, China
4 University of Chinese Academy of Sciences, Beijing 100049, China
Abstract
Cross-modal selective attention enhances the processing of sensory inputs that are most relevant to the task at hand. Such differential processing could be mediated by a swift network reconfiguration on the macroscopic level, but this remains a poorly understood process. To tackle this issue, we used a behavioral paradigm to introduce a shift of selective attention between the visual and auditory domains, and recorded scalp electroencephalographic signals from eight healthy participants. The changes in effective connectivity caused by the cross-modal attentional shift were delineated by analyzing spectral Granger Causality (GC), a metric of frequency-specific effective connectivity. Using data-driven methods of pattern-classification and feature-analysis, we found that a change in the a band (12 Hz–15 Hz) of GC is a stable feature across different individuals that can be used to decode the attentional shift. Specifically, auditory attention induces more pronounced information flow in the a band, especially from the parietal–occipital areas to the temporal–parietal areas, compared to the case of visual attention, reflecting a reconfiguration of interaction in the macroscopic brain network accompanying different processing. Our results support the role of a oscillation in organizing the information flow across spatially-separated brain areas and, thereby, mediating cross-modal selective attention.
Keywords: Human EEG; Audiovisual selective attention; Granger Causality; Pattern classification
|
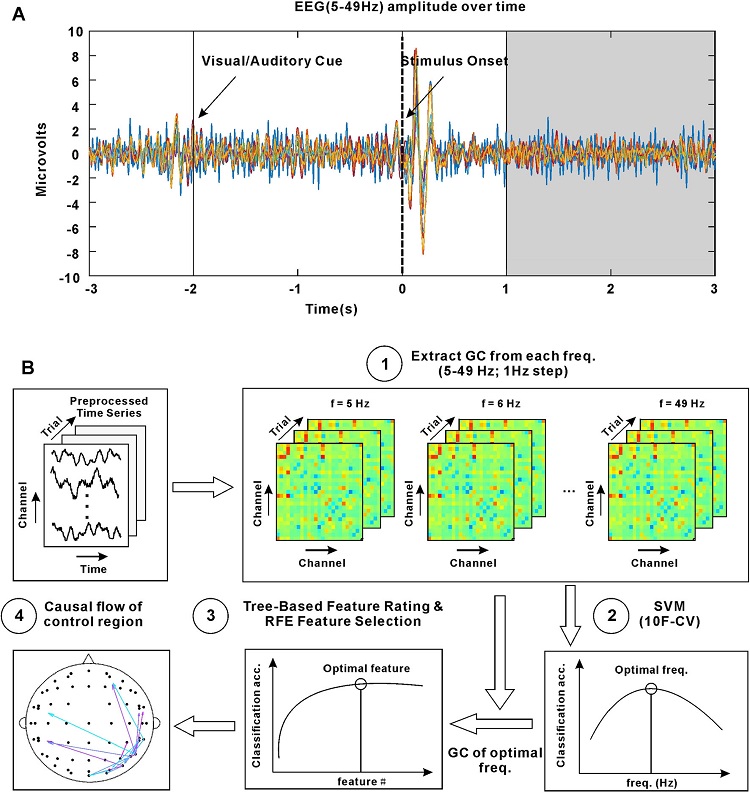
| Figure Example EEG traces and data analysis pipeline. A Band-pass filtered EEG from Subject 1 during a typical trial. Different colors represent different electrodes. The vertical solid line at -2 s indicates the onset of the visual or auditory cue; the vertical dashed line at 0 s indicates the onset of an audiovisual stimulus; and the shaded area at 1–3 s indicates the period we analyzed. B The data analysis pipeline. The GCs at each frequency (5 Hz–49 Hz at 1-Hz step) were calculated and used as features for binary classification with a support vector machine (SVM). The optimal frequency was then identified to select the optimal features. The causal flows of the nodes related to the optimal features were then calculated for further analysis (10FCV, 10-fold cross-validation). |