- Home >> Latest News
Impact of COMT haplotypes on functional connectivity density and its association with the gene expression of dopamine receptors
Jie Tang1 ,Yanjun Li1 ,Jiayuan Xu1 ,Wen Qin1 ,Qian Su2 ,Qiang Xu1 ,Bing Liu3 ,Tianzi Jiang3 ,Chunshui Yu1
1 Department of Radiology and Tianjin Key Laboratory of Functional Imaging, Tianjin Medical University General Hospital, No. 154, Anshan Road, Heping District, Tianjin 300052, People’s Republic of China
2 School of Medical Imaging and Tianjin Key Laboratory of Functional Imaging, Tianjin Medical University, Tianjin, People’s Republic of China
3 Brainnetome Center, Institute of Automation, Chinese Academy of Sciences, Beijing 100190, People’s Republic of China
Abstract
Catechol-O-methyltransferase (COMT) affects brain connectivity via modulating the dopamine system, with an expected greater effect of haplotypes than single-nucleotide polymorphism (SNP). The action pathway from COMT to dopamine to connectivity is theoretically dependent on the gene expression of dopamine receptors. Here, we aimed to investigate the impact of COMT haplotypes on brain functional connectivity density (FCD) in hundreds of healthy young subjects, and to disclose the association between the COMT-FCD statistical map and the spatial expression of the dopamine receptor genes. We found an inverted U-shaped modulation of COMT haplotypes on FCD in the left inferior parietal lobule that is mainly connected to the frontal and parietal cortices, with APS homozygotes exhibiting greater FCD than the other five groups. However, we failed to identify any significant effect of any SNP on FCD. Utilizing gene expression data collected from Allen human brain atlas, we found the COMT-FCD statistical map was significantly associated with the expression patterns of the dopamine receptor genes. Our results suggest that COMT haplotypes have greater impact on functional connectivity than a single genetic variation and that the association between COMT and functional connectivity may be dependent on the gene expression of dopamine receptors.
Keywords: Allen human brain atlas · COMT · Functional connectivity density · Functional magnetic resonance imaging · Haplotype
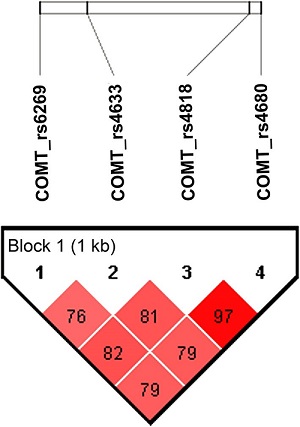 | Fig. 1 Linkage disequilibrium (LD) structure of four single-nucleotide polymorphisms (SNPs) within COMT in our sample |
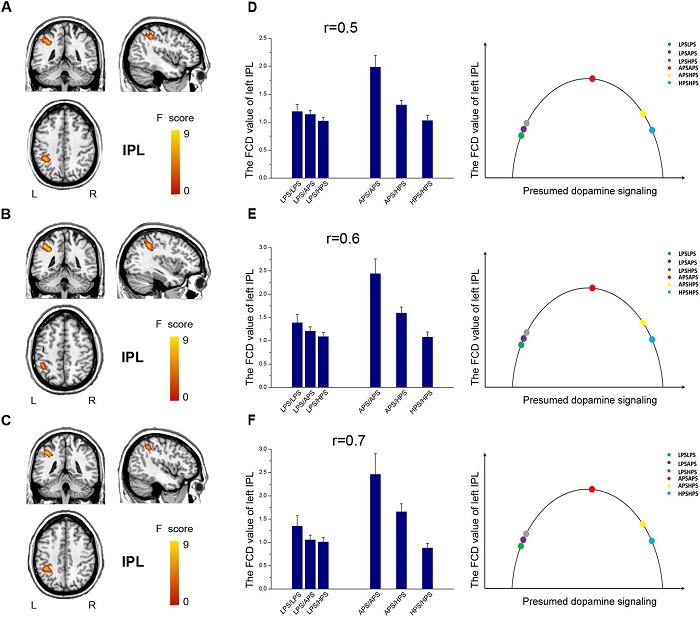 | Fig. 2 Effects of COMT on the brain FCD under different connection thresholds. a–c Show brain regions with significant effects of COMT haplotypes on the brain FCD with connection thresholds of 0.5, 0.6 and 0.7, respectively. d–f Illustrate the nonlinear modulation of the presumed dopamine signaling (constructed by COMT haplotype groups) on the FCD of the IPL obtained with connection thresholds of 0.5, 0.6 and 0.7, respectively. The horizontal axis of the bar plot represents six haplotype subgroups with the presumed dopamine signaling from low to high. The left bar plots depict the mean value and standard error. The right columns depict the locations of each imaging phenotype on the curve. COMT catechol-O-methyltransferase, FCD functional connectivity density, IPL inferior parietal lobule, L left and R right
|
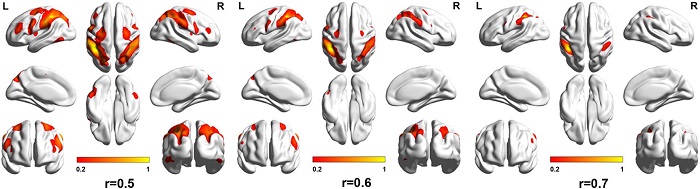 | Fig. 3 20% connection probability maps of the left IPL at the threshold 0.5, 0.6 and 0.7. The maps at different connection thresholds consistently show that the left IPL mainly connects with the bilateral parietal and prefrontal cortices. As expected, the brain regions connected with the left IPL shrink as the connection thresholds increase. IPL inferior parietal lobule
|
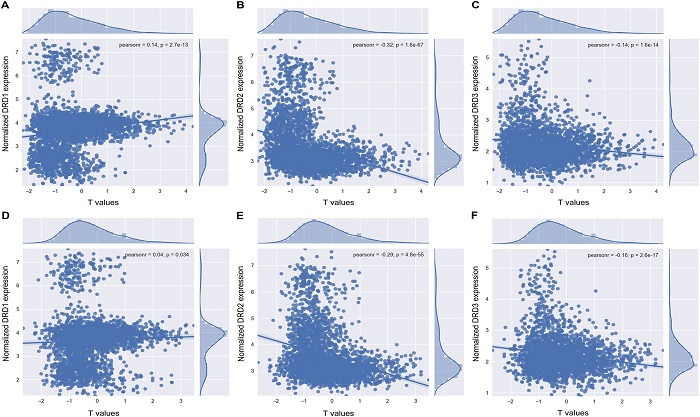 | Fig. 4 Scatter plots depicting relationship between the effects of COMT haplotypes on FCD and the normalized expression of dopamine receptor genes. The upper row shows correlations between the normalized expression values (y-axis) of DRD1 (a), DRD2 (b) and DRD3 (c) and T-statistic values (x-axis) corresponding to the group difference between APS/APS and the combination of LPS/HPS, LPS/APS and LPS/LPS. The lower row shows correlations between the normalized expression values (y-axis) of DRD1 (d), DRD2 (e) and DRD3 (f) and T-statistic values (x-axis) corresponding to the group difference between APS/APS and the combination of HPS/HPS and APS/HPS
|